

From job levels and market data to salary ranges and employee placement — with a worked example.
All numbers in this article are illustrative. Don’t benchmark against them. Follow the method, then plug in your own data.
In this Article:
- Introduction: Why Salary Structures Matter
- Do All Organizations Need a Salary Structure?
- What is a Salary Structure (or Pay Structure or Compensation Framework)?
- Phase 1: Scope and Diagnose
- Phase 2: Defining the Philosophy
- Phase 3: Internal Architecture
- Phase 4: Job Evaluation
- Phase 5: Grade Creation
- Phase 6: Market Benchmarking
- Phase 7: Salary Range Design
- What Next?
ABC Technologies has 200 employees and still does not have a formal salary structure. The company has managed reasonably well, with no major employee complaints and no significant hiring challenges so far. Sumukhi is now hiring a Senior Financial Analyst for her team and believes that the candidate, Ratna, is an excellent fit for the role. She approaches Arvind from HR.
Sumukhi: Hey! I’m hiring Ratna for the Senior Financial Analyst position. We’d like to make her an offer of INR 20 lakh. Is that doable?
Arvind: The existing analysts at that level are currently paid between 10-15 lakh.
Sumukhi: I understand, but Ratna is an exceptional candidate. We must hire her.
Arvind: Fair enough, let us go ahead with the offer (conversation truncated – after all, decisions are rarely that simple! )
Sumukhi: There’s another concern. I’ve interviewed seven candidates for this role, and most of them expected salaries well above what you just mentioned. Are our salary levels competitive enough?
Arvind: That’s a difficult question to answer. Now that we’re growing rapidly, we need a proper structure in place. Without one, it’s hard to determine whether we’re paying competitively or fairly.
Six months later, Sumukhi informs Arvind that one of her experienced team members has resigned after discovering that Ratna was being paid significantly more for essentially the same job.
As the organization continues to grow, it becomes clear that compensation decisions can no longer be made on a case-by-case basis. Designing a well-structured compensation framework has now become a business necessity.
Do all organizations need a salary structure?
No. ABC Technologies did not have one, and they still managed to grow. So, the real question is: at what point must we have a framework to make repeated, well-informed, and logical pay decisions?
Someone may say: as long as employees feel they are being paid fairly for their jobs, you do not need to think about salary structures. But that’s a very reactive way of thinking – perception is a lagging indicator, because pay is opaque and the cost shows up as resignations.
Moreover, does one ever feel that their compensation is just right? Can you really measure what employees feel? Conduct a survey, the same someone may say. We’ll leave the challenges of employee surveys, and surveys in general, for another day.
So, the question is: how do I know? Look for triggers.
- Are you finding it difficult to hire candidates from the market?
- Are certain teams experiencing consistently high attrition?
- Do salary increase decisions feel arbitrary?
- Does pay seem misaligned with job level or performance?
If you are consistently seeing these triggers, you need to act fast. Design a framework. A salary structure may be a good place to start.
What is a Salary Structure (a.k.a. Pay Structure, Compensation or Reward Framework – not CTC Breakup)?
A salary structure is really three things: job levels, salary ranges, and rules for where people sit in those ranges. Instead of negotiating every salary from scratch, organizations define job levels and salary ranges so that hiring, promotions, and salary increases can be managed consistently.
There are multiple approaches to designing salary structures, each with its own pros and cons. What we will discuss here is how the Rewards Team in a young organization like ABC Technologies can start building a structure from scratch.
The underlying assumption is that the Rewards team of ABC Tech. will drive the project with minimal external consulting support. This is to ensure that we cover most of the aspects in this discussion.
Before You Start Building, Understand What You Want to Achieve
When designing such frameworks, keep in mind that pay frameworks cannot be changed overnight just because they have some issues. Once designed and implemented, the Rewards team should keep looking for problem areas and address them. However, from a broader perspective, compensation frameworks (not pay-ranges, which is only one of the outcomes) tend to remain in place for years. Therefore, before you start, have an absolutely clear vision of what is expected out of this design process.
Phase 1: Scope and Diagnose
- Discussions with the Leadership Team – CEO, CFO, CHRO, and a few Function Heads about the business plan, budget appetite, hiring plans, and current pain points. Think long term, not just about the next one or two years.
- Understand the employee master (file containing individual employee’s information): roles, functions, current grades, salary details, the mix of fixed and variable pay.
- Review current compensation practices – including hiring offers, promotion increases, annual salary increases, and retention actions.
- Review employee attrition and offer-decline data.
Outcome: A preliminary diagnosis of the status quo and understanding the future plans, that’s it! At this point, do not start looking for solutions.
Phase 2: Defining the Philosophy
Define what is ‘market’ (peer basket) for you.
Who are we competing against? Where do we typically hire from, and to which organizations do we lose our employees? The ‘Market’ may be different for your Engineering jobs and Data Scientist jobs, with some overlap.
Market Reference Point – Target Percentile
What kind of talent do we want to attract from the market, and retain? Having a clear answer to this question is very important. Only then can you decide: do we want to ‘match the market’ (i.e. market median is your reference point) for most of the roles? And have only a few niche or business-critical roles positioned at the 75th percentile?
Think about: Organizational affordability (budget constraints). Maintaining this philosophy for years comes with a cost. Set an initial direction, but revisit it once you have market data and have modelled the cost (Phase 5-6).
Pay Mix
Compensation is typically a mix of Fixed Pay, Variable Pay and Benefits. Your Sales function may have a variable-heavy structure to incentivize business growth, whereas your Engineering function may be more fixed-pay heavy to avoid creating perverse incentives (read about the Cobra Effect from British India if you’re interested in history and want to understand what we mean by perverse incentives). Where variable pay exists, it should be linked to clearly defined performance measures. We will cover pay mix and incentive design in a future article.
Location Differentials
Whether to have –
- A single national salary structure?
- Different salary structures by city tier?
- Location differentials across major talent markets?
Phase 3: Understand the Internal Architecture
In the employee master, suppose you found 30 unique roles. The next step is to define job families, such as:
- Engineering
- Data/AI
- Product
- Sales
- HR
- Finance
- Operations
Having standardized Job Descriptions covering role scope, reporting relationships, decision rights, and indicative qualifications helps significantly at this stage. You will definitely need this information in the next phases of the design. So, get this done now.
Phase 4: Job Evaluation
This is one of the most important steps in the process, and the more time and effort you spend on this, the more useful the results are likely to be.
Job Evaluation is how you rank your jobs by size: which job is bigger than which, and by how much. We’ll use the Point Factor Method, one of the most common approaches.
Start by picking your Compensable Factors, meaning the things you are willing to pay for.
Think of:
- Skills, Knowledge
- Problem Solving
- Impact of the role
- Accountability
- Working Conditions (not really relevant for ABC Tech. though. More relevant in a Manufacturing set-up)
A quick test for a good factor: would you actually pay for it, and can you see it in the job itself – in what it takes in, how it’s done or what it delivers (input-process-output)? If the answer to either is no, drop it.
Decide the Weights
- Should Accountability carry a weight of 30% or 20%?
- Assign weightages to the sub-factors too. E.g., ‘Skill’ with a total of 30% weight, can have two sub-factors: Academic Qualification (10%) and Years of Experience required for the job (20%)
- Determine degrees for some of the factors. For example, here is one for Accountability (what the job is answerable for)
| Degree / Level | Definition | Typical job | Rough scale |
| 1 | Own tasks only; a reviewer catches errors | Accounts Executive | No resources controlled |
| 2 | Own work product that others rely on; recommends but does not approve | Financial Analyst | Influences up to about INR 1 Cr |
| 3 | Owns the result of a process or a small area | Senior Financial Analyst (owns the forecast model for two business units) | Up to about INR 10 Cr |
| 4 | Accountable for the results and budget of a team or unit | Finance Manager | About INR 10 to 50 Cr |
| 5 | Accountable for the results of a function | VP, Finance | About INR 50 to 200 Cr |
| 6 | Accountable for company-wide results | CFO, CEO | Whole Organization |
From degrees to points. Each factor gets a weight, and each job gets a degree on that factor. Points for a factor = weight × (degree ÷ 6) × the total points on offer. Let’s use a 400-point scale and four factors. Here is the Senior Financial Analyst:
Some organisations make higher degrees worth progressively more points. A simple linear scale is easier to explain and reproduce, so we use it here. Whichever you choose, apply the same rule to every job.
| Factor | Weight | Degree (1–6) | Points |
| Skills | 30% | 3 | 60.00 |
| Problem Solving | 20% | 4 | 53.33 |
| Impact | 20% | 2 | 26.67 |
| Accountability | 30% | 3 | 60.00 |
| Total | 100% | 200 |
Score outcome: Job X receives a final weighted score of 150 points, as opposed to Job Y that received 200 points, indicating Job Y’s higher importance. Generally, Job Y should be paid more – but this is only the internal hierarchy of jobs. In reality, this is not always reflected perfectly in actual salaries due to incumbent differences, market premiums for certain roles, and pay-range overlaps.
Let’s be honest: job evaluation is a judgement call, and judgement is subjective, inconsistent and biased. So don’t do it alone. For the first round, get at least 3 or 4 people to score the jobs independently, then sit together and compare. Where the scores differ, talk it out. Then bring in HR, senior leadership and the function heads to take a second look, and revisit any job that still doesn’t feel right. Keep going until you agree, then lock the scores.
And the one rule that matters most: forget the incumbent. You are scoring the job, not the person doing it.
Sanity Check the Results
Do the outcomes make sense? For example:
- Is an individual contributor unexpectedly outranking their manager?
- Are similar jobs receiving wildly different scores without a valid reason?
Such cases should be reviewed before finalizing scores.
Create Job Grades:
Sort all evaluated jobs by points, ascending. Plot each job as a dot, with its rank along the bottom and its points up the side. You get a staircase that rises from left to right.
You may also plot these points on a log scale. Grades step up by a roughly constant percentage, so a log axis makes equal percentage gaps look equal. A jump from 100 to 120 then looks like a jump from 400 to 480.
Set the grade widths – look for natural clusters in your ranked scores. Clusters show up as flat stretches where several jobs sit at similar heights. The empty stretches between clusters are where the grade boundaries belong. Place the grade boundary inside each gap so that every existing job has a logical grade and future jobs have somewhere to land. Typically, each grade should start about 15%-20% points (illustrative starting points that must be tested) above the previous one, with a higher gap at the top grades.
| Step | What you have | Example |
| 1. Observe | Clusters of jobs and empty gaps | Jobs concentrated at 90–94, 111–115, 133–138, and so on |
| 2. Choose cut points | A cut inside each gap, often near the middle | 103 (between 94 and 111) |
| 3. Publish | Contiguous boundaries covering every score | G1 85–104, G2 105–124, G3 125–149 and so on |
| 4. Handle future jobs | A job landing near a cut gets a second look | A job at 124 is reviewed against the job content of G2 and G3 before it is assigned |
Name the grades: For example – G1, G2, …, G8
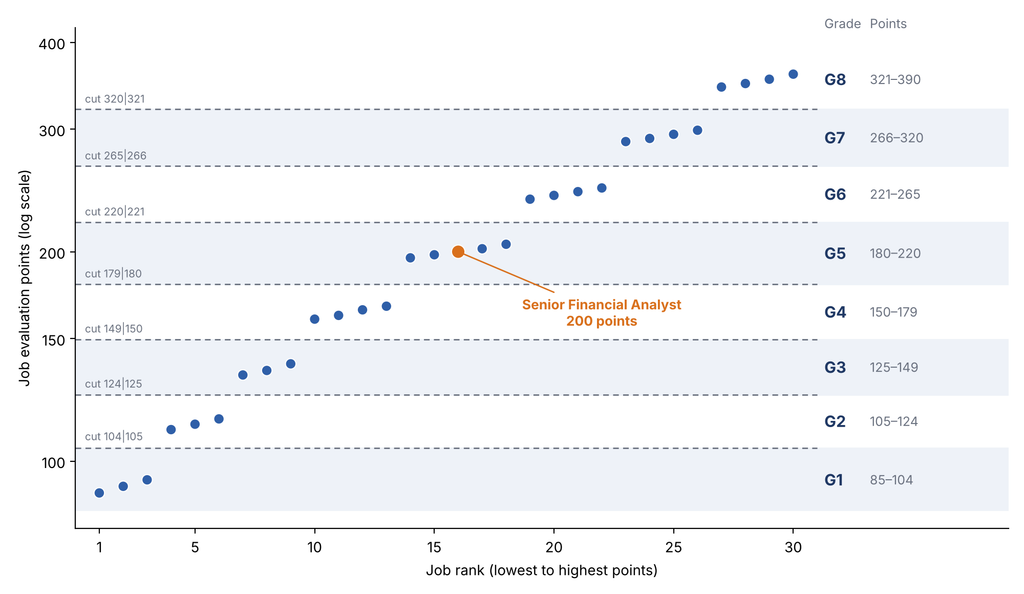
This design step will directly influence the number of grades in the organization.
- Too few grades can hide meaningful differences between jobs. Consequently, promotions become relatively rare because there simply aren’t enough levels to move through.
- Too many grades create unnecessary complexity. The distinctions between grades become difficult to explain, difficult to maintain, and often add little real value.
Check how many jobs fall in each grade and review those near grade boundaries. Typically, lower grades have more jobs than higher grades, but this isn’t a strict rule.
Next, pick a job family with sufficient headcount and check how employees are distributed across grades. Employee numbers generally decrease as you move up the grade ladder. If the pattern looks unusual, investigate further.
Test the logic: Managers should generally be at least one grade above their direct reports. Treat this as a diagnostic check rather than a hard rule. Exceptions can exist for highly specialized individual contributor roles.
Expected Outcome at this point:
- Unique job roles mapped to their job families, along with evaluation scores finalized by the committee
- Similar evaluation scores, irrespective of the roles or job families, grouped into grades or levels – which become the foundation for market benchmarking and salary range design.
Phase 5: Get the External Market Data
At this point, we will select the benchmark jobs: i.e. Roles / Job Families that are common, clearly defined and easy to match in market surveys (e.g. Financial Analyst, HR Generalist). Hybrid or Unique roles are poor benchmarks. For each of these benchmark roles/families, we will need the market data across levels: entry, mid, senior, executive etc.
Say, in Phase 4, you evaluated that under the ‘Financial Analyst’ Job Family, the Senior Financial Analyst at ABC Technologies sits at G5 level.
Get the market data. Suppose you have a report from a consultant with pay data from 12 organizations, your chosen peer group. The organizations mapped their roles, Financial Analysts (and similar roles) under different titles, to the consultant’s job library and level framework, and the consultant validated the mapping. The report gives the P25, P50 and P75 of fixed pay at each level, along with the number of organisations and incumbents behind each figure, the survey date, and its definition of fixed pay. In practice the data is considerably more detailed than this simplified illustration:
| Annual Fixed Pay – INR Lakh | ||||
| Job Role (Standardized) | Level (Standardized) | P25 | P50 | P75 |
| Financial Analyst | P1 | 4.4 | 5.0 | 5.8 |
| Financial Analyst | P2 | 5.7 | 6.5 | 7.5 |
| Financial Analyst | P3 | 7.4 | 8.5 | 9.9 |
| Financial Analyst | P4 | 9.6 | 11.0 | 12.9 |
| Financial Analyst | P5 | 12.5 | 14.5 | 17.0 |
| Financial Analyst | P6 | 16.2 | 19.0 | 22.5 |
The Rewards Team now assesses and finds that ABC’s Senior Financial Analyst (G5) and consultant’s ‘Financial Analyst – P4’ is the same, or at least there is a reasonable match in terms of the job content. So, 11 Lakh becomes the market-reference Fixed Pay for ABC. Here it is important to ensure that the Market Data (11 Lakh) contain the exact components that constitute Fixed Pay at ABC Tech – for example, it should not happen that Market’s 11 Lakh includes Insurance Premium and ABC’s Fixed Pay definition does not include the same.
In practice, the consultant usually gives you level guides that make this mapping easier. Companies that benchmark every year or two find it quick, almost routine. We’re doing it for the first time, with minimal consultant help, so let’s walk through the logic ourselves.
So, while assessing the Senior Financial Analyst job – how do we know this was a ‘reasonable match’ in terms of job content and level? Compare the job against the survey’s own level definitions on fixed anchors. Never match on titles, and never use pay to decide the match, because that is circular. Pay is a sanity check afterwards.
Here is an example. The survey level definitions are for illustration only:
| Anchor | ABC G5 Senior Financial Analyst | Market Survey P3 FA | Market Survey P4 FA | Market Survey P5 FA |
| Scope | Owns forecasting and variance analysis for 2 business units (about INR 150 cr revenue) | One process or product | Multiple units or a function | Whole function |
| Complexity | Builds models, interprets ambiguous data | Standard analysis | Complex, non-routine problems | Strategic problems |
| Independence | Works independently, escalates exceptions | Guided | Largely independent | Sets direction |
| Guides others | Reviews 1–2 junior analysts | No | Guides juniors | Leads a team |
| Reporting line | Finance Manager | Senior analyst or manager | Manager | Senior manager or director |
| Experience | 5–8 years | 3–5 years | 5–8 years | 8–12 years |
| Qualification | CA or MBA | Graduate | Graduate+ | Graduate+ |
| Anchors matched | 2 of 7 | 7 of 7 | 2 of 7 |
A rating rule can be:
- Strong Match – three anchors that matter most (scope, independence, experience) all match, overall match considering other anchors exceeds ~75%
- Partial Match – sits between two levels, or one key anchor differs (blended levels)
- Weak Match – fewer matches than these
In the above example, P4 was a strong match and hence, the 11 Lakh was considered as a reference point for the job at this level.
Suppose the G5 job had no team guidance and a narrower scope. It would sit between P3 and P4. Based on your observations, you might weight P4 at 70% and P3 at 30%. Therefore, 70% of 11.0 (P4 – p50) + 30% of 8.5 (P3 – p50) = INR 10.3 lakh becomes the market reference.
Then run two checks.
- First, compare the typical experience for the level with your actual G5 incumbents, since a consistent mismatch may suggest the level is wrong
- Second, once matched, see where your current G5 pay falls against P4 p25–p75 (or p10-p90), as a sanity check only
Digressing for a moment – suppose ABC HRs wanted to save the money on the consultant spend and wanted to do the research on their own. There can be multiple options –
- Analyze Hiring, Offer-Decline and Exit data; that’s market data in a very raw format – but not a substitute for representative market-pay data
- Check online Job Postings as directional evidence – gives a vague understanding of market salaries
- Data collection through Peer Exchange and HR Contacts – here, an incentive for the other organizations to share their information can be: once received, you have promised them to share a market report with them. Not a recommended practice though, owing to competition laws.
Once data is collected, map every company’s role against ABC’s jobs. Ask the same question: Would ABC’s ‘G5 Senior Financial Analyst’ and XYZ’s ‘L4 Financial Advisor – Associate’ be the same from a job content and level standpoint? Collect the required information from your contacts and use the above-shown method.
Do this exercise for all the organizations and determine role and level equivalence for other organizations in your peer basket. The outcome of this exercise is essentially what consultants provide through their market reports.
With that quick detour behind us, let’s get back. You have got the market data. And at this point – this is going to be the most essential concept to understand: Job Evaluation helps establish internal hierarchy, while Market Benchmarking helps establish external competitiveness. In simpler words, understanding the hierarchy / relative importance of our jobs does not give us the entire picture. We also need to understand what the market pays for comparable jobs at those levels.
Both are required. Internal hierarchy without market benchmarking ignores competitiveness; market benchmarking without internal hierarchy ignores fairness.
So, the idea is: we will plot job evaluation points for a set of reference jobs (‘benchmark jobs’ from Phase 5) – i.e. to arrive at the internal hierarchy of internal jobs. Next, for these set of jobs, we will plot the market pay data – i.e. to review external competitiveness. Once these points are plotted and we come up with a best-fit equation for these points, we can predict salary that needs to be paid for non-benchmark jobs.
Phase 6: Draw the Market Pay line (a.k.a. Pay Policy Line)
Part 1 of Phase 6: Market Line and Pay Ranges
Which jobs go into the chart? Only benchmark jobs, not every job. You need enough of them to draw a line you can trust. As a rule of thumb, aim for at least 6 to 8, spread across the grades, including some at the top and bottom. With fewer than 4-5, the line is too easy to bend with one bad match. Strong matches go in. Partial matches go in too, using their blended pay (like the 10.3 lakh above) against the job’s own points. Weak matches stay out, and so do survey cuts based on very few organizations or incumbents. Those are the points that quietly distort a line.
Plot a scatter chart with – Job Evaluation points on X-Axis and Market Median (p50) for Fixed Pay on Y-Axis.
The equation can be one of these, or could be a higher degree equation too –
- Log (Market p50 for Fixed Pay) = m. Log (Job Evaluation Points) + c, or
- Market p50 for Fixed Pay = m. Job Evaluation Points + c, or
- Market p50 for Fixed Pay = m. Log (Job Evaluation Points) + c
These are different ways of modelling the relationship between job-evaluation points and market pay. Which one works best depends on the data.
Once we solve the equation, we will be able to predict the pay for other non-benchmark jobs (jobs without direct market matches).
Digressing for the second time, because this is important.
When we see a few points on an X-Y chart and want an equation out of them, our natural tendency is often to fit a straight line. The obvious next step is to check the R-squared value and declare, “this is the equation.”
The approach is not entirely wrong, but it is not entirely correct either. The points we have plotted are only a subset of reality. We do not know whether the points we have not observed would have behaved similarly. Often, the progression accelerates at the top, and a polynomial equation may provide a better fit.
We are emphasizing this because, in Compensation and Analytics, professionals often do not think beyond linear relationships. Of course, it simplifies things. But what we are often taught in our MBAs is K-I-S-S: Keep It Simple and Straightforward. Sometimes, the second “S” is Stupid, which pretty much sums up the idea!
The problem is that reality does not always cooperate. Sometimes the relationship is non-linear, sometimes there are interactions, and sometimes there are factors we have not even considered.
If you want better answers, challenge your own hypothesis. Explore alternate possibilities instead of settling on the first reasonable-looking explanation.
In the context of building a Market Pay Line for a young organization, we will start with a power curve. It looks fancy, but it is just a straight line once you take the log of both points and pay. Not because compensation always follows that shape, but because it is a practical starting point. Make it a habit to check for other possibilities before concluding that you have found the answer.
But enough of statistical philosophy for now. Let’s get back to our original objective.
- Plot your benchmark jobs in MS Excel (or any such tool) as a scatter chart: job evaluation points on the X-axis, market P50 fixed pay on the Y-axis. Now add a power trendline and tick the boxes to show the equation and R². Excel will give you something like y = cxb. A power trendline is the same as fitting log(pay) against log(points), which suits data where pay rises by a roughly constant percentage from one grade to the next. The b tells you how quickly pay rises with job size
- Don’t treat this as a hard rule. As discussed in our second digression, a power curve is merely a starting point. Explore alternate possibilities before settling on one
- Aim for a high R², say 0.90 or above, but don’t chase it. If you start tweaking the data to push R² up, you will hide the very gaps you should be looking at. So what does it actually tell you?
- How closely your points hug the line. An R² of 0.80 means job size, as measured by points, explains about 80% of the ups and downs in market pay across your benchmark jobs. The other 20% is something else: a matching error, a hot skill, a noisy survey cut
- Why it matters: you will use this line to price jobs that have no market dataThe catch: a high R² does not mean your predictions are that accurate. It only means the line fits the points you plotted. It says nothing about the jobs you didn’t
- A low R², say 0.25, is not a verdict. It’s a prompt to go and look. The usual suspects:
- Job Evaluation points alone don’t explain much of the observed pay variation
- Poor matching of benchmark jobs (Phase 5)
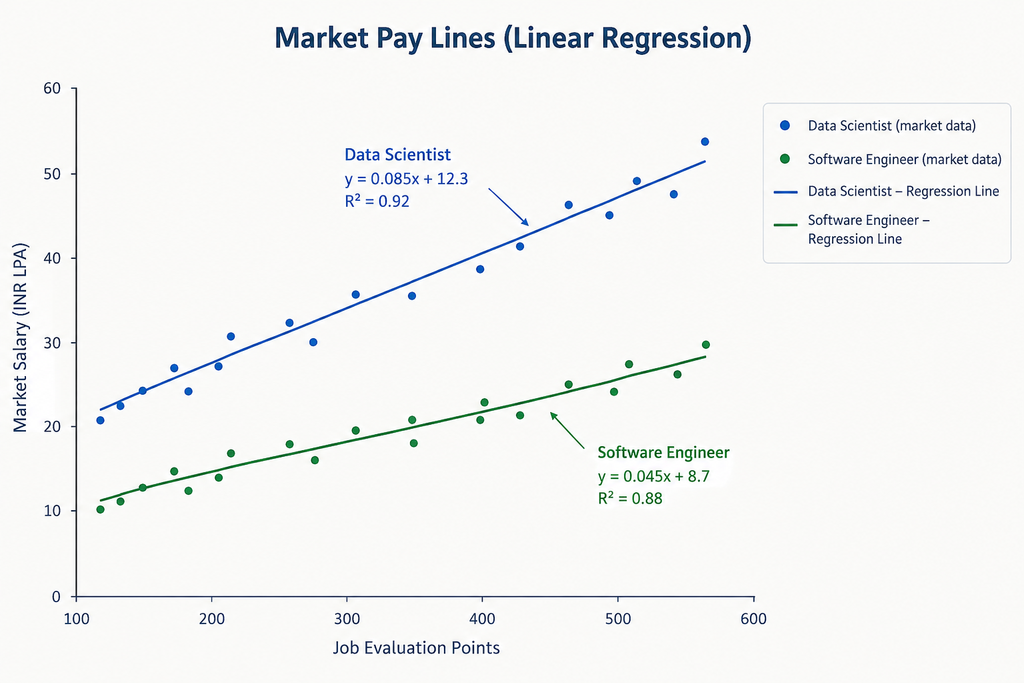
- Different Job Family treatment. Software Engineers and Sales Executives often follow different market-pay patterns and may require separate pay lines. When fitted into a single curve, the result may naturally be a low R²
- Poor Job Evaluation (Phase 4)
- Inconsistent or outdated Market Data
- A linear model does not fit the datapoints well.
- Even with R2=0.90, you should inspect the prediction errors. A model could fit most jobs well but badly misprice one critical benchmark job
- For each benchmark job, compute the gap as: (Market P50 ÷ Fitted Value) – 1
- Look at the pattern, and the size of the gap. In our example for Senior Financial Analyst, the gap is about negative 2.7% (11 from market data and say, 11.3 from pay-line equation). Anything beyond +/- 10% deserves a relook – recheck for the survey match or the job evaluation points
- Imagine, you observe that for the Data Scientist Job Family, the gap is consistently about 10% or above. So, it needs a separate pay line above the one you have drawn or a documented premium. With changing demand-supply for Data Scientist / AI talents in the market, this must be reviewed every 1-2 years, to check if the premium is required anymore or not
- If the gaps are positive at both ends and negative in the middle, the line is bending and a straight log fit is not suitable
- Check if one pay-line is enough. This is in reference to the point above (5b). Multiply by your premium-factor (1.00 to match the market in this case, maybe 1.10 to lead the market p50 by 10% for Data Scientist roles). One small but important point: 10% above P50 is not the same as P60. It can land you anywhere, maybe P52, maybe P80, depending on the distribution. This may sound painfully obvious to someone comfortable with statistics (or, in simpler language, distributions), but we have seen even experienced professionals make this mistake.
The line can estimate the market pay for any points value. But a grade covers a range of points, say 180 to 220, and every job inside it will carry the same midpoint. So we have to pick one points value to represent the grade, and read the line there.
The simplest choice is the centre of the grade’s points range. If you fit on a log scale, the geometric centre (the square root of lower bound × upper bound) is the consistent pick; if you fit a straight line on raw points, use the ordinary average. Whichever you pick, use the same rule for every grade.
For G5 (180 to 220 points), the geometric centre is ~200. Put 200 into your equation and say, you get about INR 11.3 lakh, the same figure we saw in the gap check. That is the market midpoint for the grade. Do this for every grade, including the ones with no benchmark job. That is how the line fills the gaps in your market data.
Notice that 11.3 is not the Senior Financial Analyst’s survey P50 of 11.0. The P50 is one data point, with its own matching noise. The line smooths it out, and the line’s value is what we use as the midpoint. Now we have a midpoint for every grade. Next come the grade-wise ranges
Below is an illustrative image of how a market pay-line may look like.
Build the pay-ranges
Now decide how wide each range should be. This is the spread: (Max / Min) − 1.
A common starting point is 30% to 35% for junior grades, getting wider as you go up (illustrative, test it).
You already have the midpoint from the pay-line. So, you know the midpoint and the spread, and you need Min and Max. Two formulas do it:
- Min = 2 × Midpoint ÷ (2 + Spread)
- Max = Min × (1 + Spread)
Then check the overlap between neighbouring grades: (Max of the lower grade − Min of the next) / (Max − Min of the lower grade). Aim for roughly 10% to 40% (illustrative). Pick the spread and the grade step together. If you widen the spread without touching the steps, the overlaps balloon.
Define compa-ratio bands, for example: <85%, 85% to <100%, 100% to <115%, >=115%. With a 30–35% spread the range runs from about 85% to 115% of midpoint. But what is Compa Ratio?
- Compa Ratio = Employee’s salary / Midpoint of Salary Range in which the employee fits
- Compa-ratio tells you where someone sits in their range. Below 100% means below the midpoint, above 100% means above it. A Senior Financial Analyst at ABC earning INR 10 lakh is at about 88% (10 ÷ 11.3), roughly 12% behind the midpoint
- Don’t read that as “underpaid” or “overpaid” on its own. Look at the person too: performance, when they were last promoted, how they got to the role
- A whole department sitting low or high is the real signal. It could be a poorly set midpoint, a deliberate premium, or just who you happened to hire
- In practice, organizations also use market reference points directly (typically market P50), to assess employee pay. We will revisit this distinction when we do a deep dive on Compa Ratio, in one of our future posts.
Part 2 of Phase 6: Diagnose, Plan.
Place employees and Diagnose:
- Map each employee to their grade and range, and compute compa-ratio
- Find who is below minimum, who is above maximum, and who is compressed – meaning new hires paid more than longer-serving peers
- Cost the correction for the below-minimum group, or a subset of low compa-ratio employees with high flight-risk and need to be retained. Model two or three options, whether it requires urgent fixing in one cycle or phasing it over 2-3 cycles is fine
- For people above maximum, decide between regular increases or a planned slow-down
At this point it is also important for us to get a reality check.
Remember, in Phase 2, we said we would revisit our target market percentile once we had the market data and understood the cost. Now is the time to do that. Sit with the leadership team, discuss the correction budget, and understand how much the organization is willing and able to spend.
Given the organization’s talent needs, suppose we decided to target market P50 for most roles and lead the market (say, p75 or some premium-factor on top of p50) for a few critical job families. Sounds sensible enough, doesn’t it? But can we afford to maintain it over the years? We can show leadership what the chosen strategy is likely to cost, identify where corrections are necessary, and discuss whether they need to happen immediately or over a few salary cycles.
A student targeting a score of 80 may end up scoring somewhere closer to 60-65. Just a random example. So, when organizations continue to grow and become more cost-conscious – even when the compensation philosophy targets market P50, the actual employee population may be skewed, with more employees below the market reference point than above it. Naturally, they “study for p50” and often score lower than that.
For a young organization like ABC Tech., this may not be a major concern yet. But as organizations grow, maintaining a consistent compensation philosophy can become expensive. So, it isn’t enough to decide whether we want to lead, lag or match the market. We also need to ask two questions: What kind of talent do we want to attract and retain? And can we afford to sustain this position in the market over time?
Every compensation decision comes with a cost. The idea is to understand that cost before committing to the strategy.
Back to Sumukhi and Ratna
Remember Sumukhi’s INR 20 lakh offer for Ratna? Let’s run it through what we’ve built. Say the G5 midpoint is about INR 11.3 lakh, with a 40% spread.
Range Min = 2 × Midpoint / (2 + Spread) = 9.4
Range Max = Min × (1 + Spread) = 13.2
Even the market’s P75 for a matched role is only 12.9 lakh. Ratna’s offer is about 1.8 times the midpoint, and well above both the range maximum and the P75.
Does that mean Sumukhi can’t hire her? No. A structure doesn’t ban exceptions. It makes them visible. Now Arvind can ask the right questions: is Ratna really doing a G5 job, or a bigger one? Is there a one-time joining payment that closes the gap without resetting the whole team’s pay? And who approves an offer this far outside the range? The conversation changes from “can we?” to “should we, and at what cost?”
Phase 7: Congratulations! You Have Finished Level 1. The Real Game Starts Now.
Now that you have a pay policy line – i.e. the Basic Structure, the Foundation plan – it is important to decide certain things:
- How will hiring be managed? How far above the midpoint a hiring offer can go – in what circumstances? Who approves exceptions? How will Premium talent hiring be governed?
- Merit Increment – philosophy, design, guidelines
- Promotions Framework
- Variable Pay strategy – Balanced Scorecards linkage, Short-Term and Long-Term incentives design
- Labour Laws compliance
- Communication with Leadership, Managers, HR Partners, Employees
- Annual refresh of market data, job evaluation of new roles and existing roles where scope has increased
You have only designed a structure. Now comes the harder part: keeping it relevant.
Left alone, even the best-designed structure can become stale. Keep checking for gaps. Run periodic diagnostics. Understand what is working and what is not. Trial and error is part of the process, so keep refining.
Some of the topics above deserve chapters of their own. Merit Increments, Promotions, Variable Pay Design require much deeper discussion than this article can provide. And that is exactly what we will cover in future articles at Pay Architect.